State of the Ride: SDSU and Bike SD Report on the State of Bicycling in San Diego


San Diego has built nearly 700 miles of bicycle infrastructure, but a new report argues that counting bike lanes and paths alone gives an incomplete picture of how well the city’s bicycle network actually works.
“The State of the Ride,” a report prepared by San Diego State University graduate students in partnership with BikeSD, evaluates the city’s bicycle network through a combination of geographic information system analysis, collision data, Level of Traffic Stress measurements and field observations. Its central finding is that San Diego has made measurable progress toward its bicycle planning goals, but much of the network remains disconnected, high stress and difficult for anyone outside the most confident riders to use.
The report was published on July 31 and presented to the Mobility Board on August 5th at SDSU. For more, read previous coverage in the San Diego Union-Tribune, or iNewsSource.
Madison Cranford, BikeSD board member and recent graduate from San Diego State University’s School of Public Affairs, said the report challenges a common assumption about bicycle infrastructure. The report was co-authored with Jack Noble, and Jong Houn Gang.
“The most insidious assumption I see being made about the state of San Diego’s bike system is assuming that infrastructure is equal to safety,” Cranford said. “There is much reporting on the mileage of bike facilities the city has, and emphasis on promoting bike lanes in highly trafficked, key corridors; however, if you look at the behavior and car centric infrastructure that facilitates dangerous driving and high conflict areas, infrastructure alone isn’t enough to promote biking as a feasible alternative for all types of road users.”
Streetsblog interviewed Cranford over email, and she sent some detailed responses that were too long to quote completely. If you’re interested in more of our back and forth, you can read the entire Q and A here.
Miles of Bike Infrastructure Don’t Tell the Whole Story
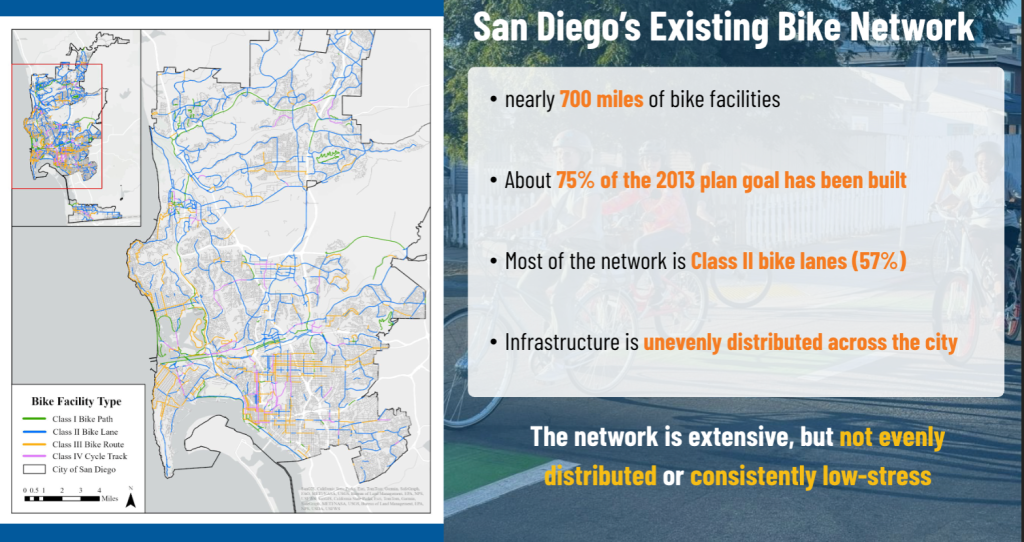
The report starts with an important number: 693 miles of bicycle facilities currently exist in San Diego. That represents roughly 75 percent of the total network envisioned in the city’s 2013 Bicycle Master Plan.
More than half, 395 miles, or 57 percent, consist of Class II bike lanes. Another 156 miles, or 23 percent, are Class III bike routes, which generally place cyclists in mixed traffic. Class I paths account for about 92 miles, or 13 percent, while the city has only about 50 miles of Class IV protected cycle tracks.
The result is a network where much of the mileage technically accommodates bicycling without necessarily creating comfortable conditions for most people.
“Looking at the data, and assuming the efficacy of a bike lane to fit the needs of users of all ages and abilities, only about 8% of the bike network on our local roads has protected infrastructure (Class I or IV),” Cranford said.
She said her own experience riding with less experienced cyclists illustrates the problem.
“Many potential bicyclists are deterred from exploring areas not completely protected,” she said. “I myself warn people new to biking to reconsider biking to new destinations without an experienced cyclist, urging them to connect with public transit instead.”
The researchers used the Level of Traffic Stress (LTS) system to examine the broader network of roads where bicycles are legally permitted. LTS 1 represents very low stress conditions, while LTS 4 represents the highest level of stress.
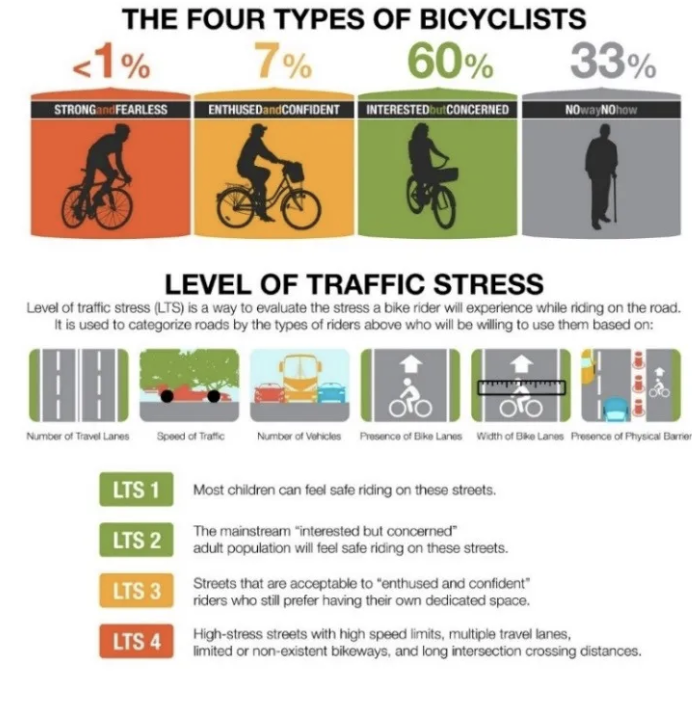
The report argues that a successful bicycle network should not be designed solely for experienced cyclists willing to ride alongside traffic. San Diego’s own policies increasingly embrace an “All Ages and Abilities” approach intended to make bicycling viable for children, older adults and people who are less comfortable riding in traffic.
Cranford argues that the problem goes beyond simply putting physical barriers between bicycles and cars.
“Plastic bollards can only do so much, dozens of conflict points due to lane changes and driveways increase the potential for collisions, and simply it is not comfortable biking next to cars going 35+ mph,” she said.
“If we are to tangibly increase accessibility to biking as a mode shift to reduce greenhouse gases, promote neighborhood health, increase safe routes to schools for children, and improve active transportation connections to key destinations, then we need to focus on implementing corridors that look to shift driver behavior through methods such as traffic priority signals, road diets, bulbouts, etc., while also protecting vulnerable road users such as bicyclists.”
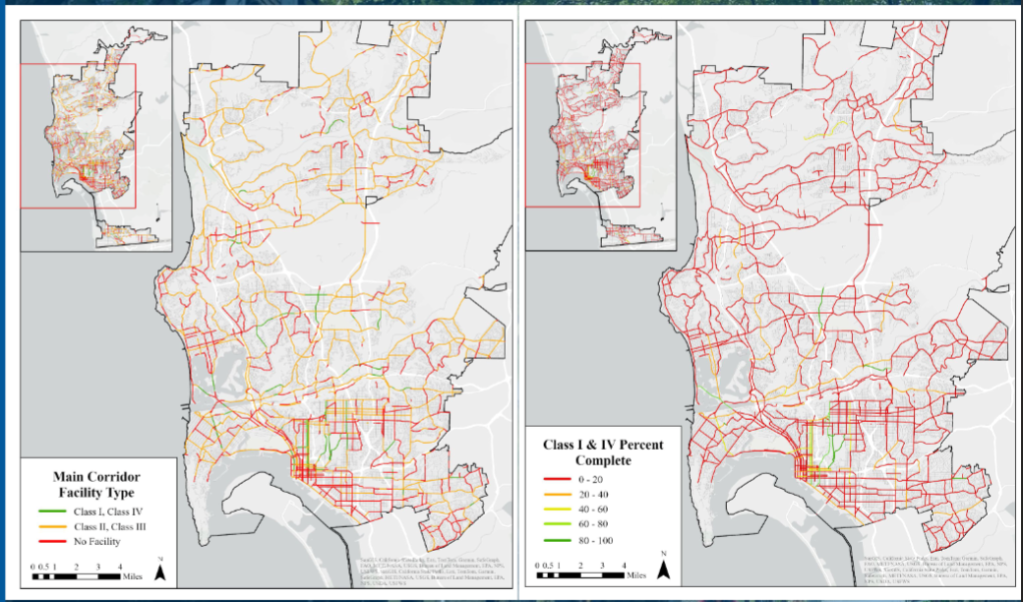
The Most Important Corridors Are Often the Most Stressful
The researchers therefore combined stress measurements with another question: Where can people actually get to by bicycle?
They analyzed access to seven types of everyday destinations, including schools, parks, transit stops, shopping centers, grocery stores and libraries. The resulting analysis divided the network into four categories based on stress and connectivity.
About 44 percent of the network is low stress but also has low connectivity. Another 24 percent is both low stress and highly connected, representing the strongest portions of the system. Seventeen percent is high stress and low connectivity.
The remaining 15 percent is perhaps the most important category: high stress, high connectivity corridors.
These roads connect people to important destinations but are uncomfortable or unsafe for many potential riders. The report identifies them as the most critical opportunities for investment because improving them could simultaneously increase safety, accessibility and network connectivity.
The problem becomes particularly pronounced on major arterials and collector streets, like El Cajon Blvd, Adams Avenue, Euclid Avenue, and Mira Mesa Blvd. Those roads tend to have high connectivity because they link neighborhoods and destinations, but they also have substantially higher traffic stress. Major arterials and collectors have median LTS scores of 4, compared with a median of 1 on local streets.
The report’s collision analysis reinforces the concern. LTS 4 roads account for approximately 51 percent of all fatal and serious injury bicycle collisions analyzed in the study, despite representing only part of the overall network. LTS 3 roads account for another 18 percent. By comparison, LTS 1 roads account for 24 percent of collisions and LTS 2 roads for 6 percent.
The researchers also found substantial differences between bicycle facility types. Class I paths had the strongest safety and comfort profile, while Class II bike lanes and Class III bike routes were associated with much greater exposure to collisions. Class II facilities accounted for more than half of the fatal and serious injury collisions in the facility level analysis.
The report cautions that collision numbers cannot simply be interpreted as proof that a particular facility causes crashes. Higher collision totals may partly reflect higher bicycle use on those routes. Nevertheless, the findings demonstrate that simply designating space for bicycles does not necessarily create a low stress or safe facility.
To supplement the data analysis, the researchers conducted field audits of five major corridors: El Cajon Boulevard, Euclid Avenue in Mid City/City Heights, Genesee Avenue in UTC, Mira Mesa Boulevard, and Pacific Highway, near Downtown.
The fieldwork found a recurring pattern: isolated improvements surrounded by long stretches where bicyclists must ride alongside fast moving traffic.
On El Cajon Boulevard, for example, the corridor has an average LTS of 3.84 and 11 fatal or serious injury collisions. Euclid Avenue has an average LTS of 3.72, 14 fatal or serious injury collisions and protected bicycle infrastructure missing from 95.4 percent of the corridor. Genesee Avenue is similarly fragmented, with 96.2 percent of the corridor lacking protected bike lanes and 21 fatal or serious injury collisions.
The conditions are even more stark on Mira Mesa Boulevard, where 99.6 percent of the audited corridor lacks protected bicycle infrastructure. The entire corridor receives an LTS 4 rating, and researchers identified 19 fatal or serious injury collisions.
Cranford sees Mira Mesa Boulevard as a particularly promising opportunity for a broader transformation.
“The rapid sprouting of apartments, concentrations of schools, and wide array of groceries, stores, and eateries positions Mira Mesa to be retrofitted for easy biking,” she said.
She described the boulevard as an “audacious ‘local freeway’” that could be transformed through a combination of traffic calming, protected infrastructure, speed enforcement and transportation technology.
“If that audacious ‘local freeway’ could be converted into a calmed, two way roadway with protected infrastructure, enforced speed limits, and intelligent transportation technology for safety, then we could begin the transformation of an area emblematic of car centric urban sprawl into a multimodal network.”
On the Pacific Highway, isolated examples of high quality treatments, such as green paint and bike boxes, coexist with long stretches of high speed roadway without protection. About 83.6 percent of the corridor lacks protected bicycle infrastructure, and researchers identified 23 fatal or serious injury collisions.
“It’s nothing new but the data support, and the people have been shouting from the rooftops, that Pacific Highway is one of the most critical corridors in need of updated bicycle and road infrastructure,” she said.
The corridor has a Level of Traffic Stress score of 3.75, with almost 90 percent of the corridor lacking bicycle protection. Within five years, there have been 23 fatal or severe injury bicycle collisions.
“This corridor can provide a crucial north and south link to within the city,” Cranford said. “These corridors connect the new age urbanites, San Diego families, and coastal lovers to the beauty and community San Diego is known for.”
Beyond Bike Lanes
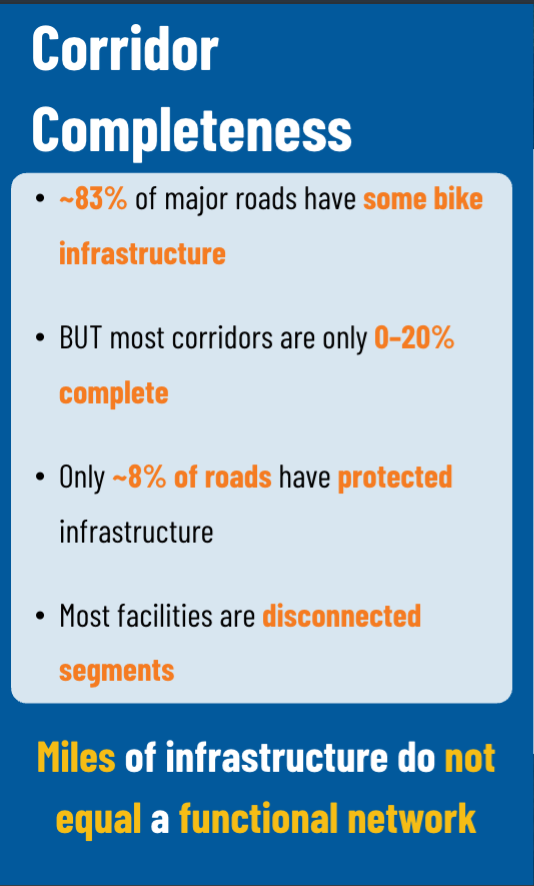
Taken together, the findings lead the report to a broader conclusion about San Diego’s bicycle policy: the city has often measured success by what it has built rather than by whether the resulting network actually works.
The researchers describe this as a gap between policy adoption and implementation. San Diego has ambitious goals in its Bicycle Master Plan and Climate Action Plan, including increasing the bicycle mode share. But the report argues that there is not yet a sufficiently transparent system for tracking whether those policies are producing a connected, low stress network.
Cranford also argues that bicycle infrastructure should not be viewed in isolation from the rest of the transportation system.
“The one thing I want to add is that it seems like the narrative around bike infrastructure and cycling as a whole is isolated from any other transportation options,” she said. “It’s either you’re a cycling fanatic or a Cybertruck driver.”
“If we really want to provide mode shift, start to connect our communities and foster communal living, integration and collaboration with our neighbors and our local environment, we need to use all threads available to weave a reimagined tapestry of urban living.”
That means, she said, expanding public transit, experimenting with microtransit and carsharing, expanding bike share and bike parking, and promoting affordable and middle income housing near key destinations and employment.
“This is all necessary to not only expand safe biking for everyone, but for the vitality of all of our San Diego neighborhoods,” she said.
Importantly, the report does not simply produce a list of streets the city should rebuild. Instead, its major contribution is a framework for evaluating the network on an ongoing basis.
The researchers recommend that future work develop a data driven corridor prioritization system combining safety, potential demand, connectivity, equity, topography, and feasibility. Such a system could help determine where limited funding would produce the greatest benefits rather than allowing projects to emerge primarily from political or opportunistic considerations.
The report’s larger message is straightforward: San Diego does not necessarily need to start over. It needs to finish the network it has already planned and make sure the pieces work together.
The city has built hundreds of miles of bicycle facilities. But until those facilities form continuous, low stress routes connecting people to the places they need to go, the report concludes, the number of miles on the map will remain a poor measure of whether San Diego is truly a city where bicycling is an accessible form of transportation.

Streetsblog has migrated to a new comment system. New commenters can register directly in the comments section of any article. Returning commenters: your previous comments and display name have been preserved, but you'll need to reclaim your account by clicking "Forgot your password?" on the sign-in form, entering your email, and following the verification link to set a new password — this is required because passwords could not be carried over during the migration. For questions, contact tips@streetsblog.org.